Monitoring tools have become an indispensable foundation in the world of modern technology. Monitoring tools act as the eyes and ears in an increasingly complex IT ecosystem, helping organizations optimize the performance of applications, infrastructure and business services.
Monitoring tools provide the visibility needed to understand how systems work by quickly identifying problems before they impact end users. This allows organizations to take appropriate action to avoid financial and reputational loss.
In this article, CDT invites you to explore the purpose of using monitoring tools and why it is important for organizations to adopt these tools. Read the answers below.
What is Monitoring Tools?
Monitoring tools are systems used to continuously monitor and control IT infrastructure, applications, and networks to ensure the availability, performance, and reliability of IT systems, as well as the early detection of problems or failures that may occur.
By using monitoring tools, organizations can ensure that the system is operating properly, identify problems early, and optimize system performance. Here are some of the purposes of using monitoring tools
- Track system, network, or application performance, including CPU usage, memory, and network throughput.
- Identify problems or malfunctions in system hardware, software, and configuration before damage or downtime occurs.
- Ensure that the system or application is always available
- Analyze monitoring data to improve system performance and efficiency and reduce resource waste
- Detect suspicious activity or security attacks on the system to maintain data security
- Measure and report on the end-user experience when using an application or service. This helps ensure that users have a good experience and don’t encounter problems that affect their satisfaction.
Gen 2 vs. Gen 3 Monitoring Tools: The Benefits of Gen 3 Monitoring Tools for Today’s IT Ecosystem
Monitoring tools have conceptually evolved three times and are known as first generation, second generation and third generation. In Gen 2, monitoring tools focused more on measuring and monitoring basic infrastructure such as CPU, memory, network, and storage. Gen 2 also is rather reactive, such as providing reports on problems after they have occurred.
Meanwhile, Gen 3 monitoring tools focus on holistic, end-to-end monitoring, including service level monitoring and end-user experience. Gen 3 tends to be smarter, powered by AI and Machine Learning to identify problems and take action before they impact users.
The presence of Gen 3 is considered a complement to the limitations of Gen 2 tools, especially to meet the needs of increasingly complex and distributed infrastructures and applications. By deploying Gen 3 monitoring tools, organizations can detect and resolve problems faster before they have a major impact, reduce manual intervention and downtime, and provide more in-depth and accurate analysis.
You could say that Gen 3 monitoring tools provide more powerful and intelligent solutions to help organizations meet the greater challenges of ensuring system availability, performance, security and reliability in today’s complex IT environments.
Well, one of the Gen 3 monitoring tool solutions that is widely used by many organizations is Dynatrace Full Stack Monitoring. Combining the unmatched power of Gen 3 tools with Dynatrace’s proven Application Performance Monitoring (APM) services, Dynatrace Full Stack Monitoring is the perfect solution for those who want to deploy a comprehensive and sophisticated monitoring system.
Dynatrace Full Stack Monitoring, an Advanced and Reliable Monitoring Tools Solution

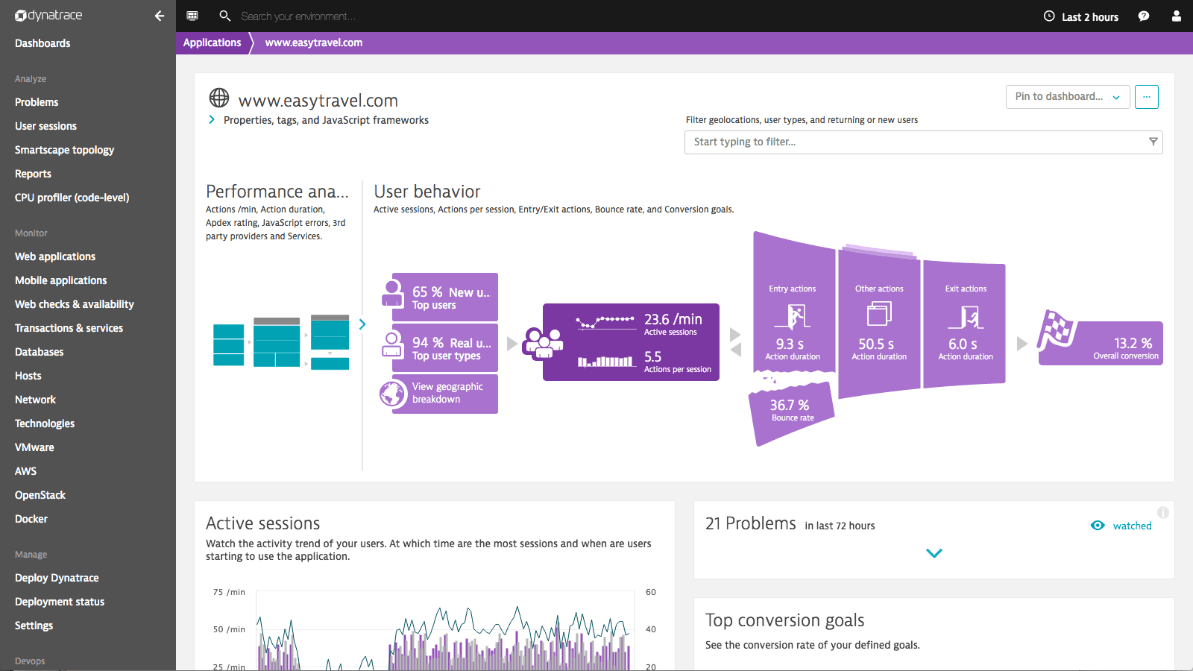
Source: Dynatrace – Full Stack Monitoring
Dynatrace Full Stack Monitoring is a comprehensive monitoring platform designed to provide end-to-end visibility into the entire IT infrastructure and applications. Dynatrace provides a monitoring tools solution suitable for monitoring and managing complex IT environments, including physical and virtual infrastructure, public cloud, private cloud and other applications.
With the Gen 3 approach, Dynatrace Full Stack Monitoring can perform many tasks that previously had to be done manually. From manually analyzing issues to find root causes, to looking at trend charts to identify changes, to guessing if an issue could impact your business. All three can now be done automatically.
Dynatrace Full Stack Monitoring is equipped with AI and Machine Learning capabilities to solve the above problems. With these advanced features, Dynatrace Full Stack Monitoring can automatically tell you where the problem occurred, what caused it, and which users were affected with high accuracy. This is supported by the advantages of Dynatrace Full Stack Monitoring, which can collect a lot of data collected by Dynatrace Agent.
As an Application Performance Monitoring (APM) solution that is widely used by various companies, there are some key features of Dynatrace Full Stack Monitoring that you need to know.
- End-to-End Monitoring: Monitor all layers of the IT infrastructure, including applications, servers, databases, networks, and end users.
- AI-powered: Detect problems, identify root causes, and suggest improvements in real time
- Real-Time Monitoring: Minimize downtime with real-time monitoring for faster response
- User Experience Monitoring: Monitor user experience by detecting and tracking issues such as slow web or application speeds
- Root Cause Analysis: Identify root causes with in-depth analysis to help IT teams quickly find and fix problems
- Auto Scaling and Optimization: Automatically adjust resource capacity based on application demand while reducing operational costs
- Security Monitoring: Comprehensive security capabilities to detect and protect applications from security threats
Benefits of Dynatrace Full Stack Monitoring
Dynatrace Full Stack Monitoring provides organizations with a number of significant benefits in monitoring and managing their IT ecosystem, including
1. Improved User Experience
The only monitoring tool solution that combines real user monitoring, synthetic transactions and session replay for complete visibility into every digital activity. Understand customer behavior, visualize the impact of problems, and optimize each user’s experience.
2. Code-level Monitoring for All Applications
Code-level observability for any application architecture running in the cloud, on-premises, or hybrid. Track any activity at any level without missing a gap or blind spot, going from user click to code level in seconds.
3. Automated Cloud Platform and Infrastructure Monitoring
End-to-end monitoring of every layer of IT infrastructure from hosts, PaaS and containers, process detection and resource utilization, network usage and performance, log monitoring, and aggregating data into a full stack.
4. Full Visibility
Gain complete visibility into all parts of the IT infrastructure, including applications, servers, networks and databases.
Find out how Dynatrace Full Stack Monitoring Provides Comprehensive Oversight of Your Enterprise IT Ecosystem with CDT Experts
Don’t let system errors affect your business. It’s time to optimize the performance of your IT infrastructure with a comprehensive monitoring solution from Dynatrace Full Stack Monitoring. Central Data Technology (CDT), as Dynatrace’s authorized partner in Indonesia, will help you understand the monitoring tools system according to your business needs.
Supported by a professional, experienced and certified IT team, CDT will also help you through the consulting, deployment, management and after-sales support to avoid trial and error when implementing Dynatrace Full Stack Monitoring.
Interested in the Dynatrace solution? Contact us today by clicking the link below.
Author: Wilsa Azmalia Putri
Content Writer of CTI Group

